Wales Public Health Rapid Overview Dashboard
What is the Rapid Overview Dashboard?
Published: 8 December 2023
The first release of the Wales Public Health Rapid Overview Dashboard, created by the Observatory & Cancer Analysis Team and the Communicable Disease Surveillance Centre, is now available.
As this is our first release, we are always looking for ways to improve and develop it to ensure that they are user-friendly and meet user requirements. After you have used the dashboard, we would really appreciate any comments or feedback to help us improve it. Please get in touch with us at: Publichealthwalesobservatory@wales.nhs.uk
The aim of the dashboard is to look at the big picture on population health and health inequalities in Wales, and to track how these are changing over time.
The dashboard provides up to date information across a series of topics. Currently you can explore data in relation to:
-
Delivering excellent public health services
-
Supporting a sustainable health and care system
-
Mortality
-
Promoting healthy behaviours
-
Promoting mental and social wellbeing
-
Influencing the wider determinants
The dashboard was created to provide a suite of high-level, timely indicators, most of which are updated either fortnightly or monthly.
Indicator Map
Developments
To ensure the dashboard is up to date, chart data is refreshed every two weeks or monthly, depending on the data source. Please note that some indicators are updated on a quarterly, or longer, basis and some are no longer updated, due to data availability. Information on the update schedule for specific indicators can be found in their metadata section on the dashboard.
At present, no further indicators are planned for inclusion, however, this will be kept under regular review to ensure the dashboard aligns with user needs. The COVID-19 booster campaigns will be updated to reflect the current campaign.
Any future planned developments will be documented here.
Feedback
As this is our first release, we are always looking for ways to improve and develop it to ensure that they are user-friendly and meet user requirements. After you have used the dashboard, we would really appreciate any comments or feedback to help us improve it. Please get in touch with us at: Publichealthwalesobservatory@wales.nhs.uk
Technical report
The section below contains sections providing background information for all data sources used in the dashboard. It also contains our accessibility statement.
ICNET
ICNET is the clinical surveillance software used by Public Health Wales to source the data used in the COVID-19 hospitalisation indicator.
For this indicator, a case is defined as a positive SARS-CoV-2 PCR test taken in Wales. For data up to 25/05/2022, one positive test per person within a 42 day period is counted as a case. From 26/05/2022, the de-duplication period has increased to 90 days.
An admission is defined as an overnight stay in hospital. The day of admission is counted as day 1 of an inpatient stay and transfers to other hospitals within the same health board are regarded as the same continuous inpatient stay.
Test data is extracted from the PHW Datastore database. Hospital admission data is extracted from hospital patient administrative systems via ICNET. Tests and admissions data is linked using the patient NHS number.
The ICNET dataset is used in figure 1 on the ‘Communicable disease’ page.
Welsh Immunisation System (WIS)
Welsh Immunisation System (WIS) is an information system for the management, distribution and reporting of the COVID-19 Vaccination Programme.
The system uses information on patient demographics, occupation groups and agreed priority levels for receiving the vaccination, to allow healthcare professionals to schedule appointments for patients. It can create appointment slots and record details about each vaccination for every COVID-19 vaccine administered in Wales.
The data for our COVID-19 vaccination indicators is supplied by this system.
For more information, please visit the DHCW WIS site.
The WIS dataset is used in figure 2 on the ‘Communicable disease’ page.
Healthcare Associated Infection, Antimicrobial Resistance & Prescribing Programme (HARP), Healthcare Associated Infection (HCAI) &, Antibiotic Data Library
The Healthcare Associated Infection, Antimicrobial Resistance & Prescribing Programme (HARP) supports the NHS in Wales to reduce the burden of healthcare associated infections and antibiotic resistance across Wales. This is delivered through feedback of surveillance data and the promotion of appropriate antimicrobial prescribing and interventions to prevent the spread of infections.
They are a multidisciplinary team with expertise in infection prevention and control, medical microbiology, antimicrobial prescribing and resistance, surveillance and epidemiology.
Information from HARP is used in our indicators on HCAI and Antimicrobial resistance and usage
For more information, please visit the HARP site.
The HARP, HCIA, Antibiotic Data Library dataset is used in figure 5 ,6 and 7 on the ‘Communicable disease’ page.
National Community Child Health Database (NCCHD)
The National Community Child Health Database (NCCHD) includes details relating to maternal and child health related indicators such as births, immunisation screening, safeguarding children and breastfeeding.
Each of the seven health boards in Wales has a Child Health System database which they manage locally. Anonymised records for all children born, resident or treated in Wales and born after 1987 are collated from each of the local databases each quarter to create the NCCHD.
The statistics relate to live births born to Welsh residents during the relevant calendar year. The analyses are for live births only and do not include stillbirths. However, births occurring in Wales (whether to Welsh or non-Welsh residents) can also be counted by the NCCHD.
The NCCHD dataset is used in figure 4 on the ‘Communicable disease’ page.
Referral to Treatment Times (RTT)
An RTT pathway covers the time waited from referral by a GP or other medical practitioner to hospital for treatment in the NHS in Wales and includes time spent waiting for any hospital appointments, tests, scans or other procedures that may be needed before being treated.
Due to the COVID-19 (Coronavirus) pandemic, all non-urgent outpatient appointments were suspended in March 2020. This meant that most hospitals had to reduce or suspend the services they offered, which led to an increase in both the lengths of waits and the number of people waiting on patient pathways for the month of April 2020 and subsequent months.
In March 2016, some of the terminology used in referral to treatment reporting changed. Previously, when publishing these statistics, the term ‘patients’ was used, however, some users misinterpreted this as unique patients. It is possible that a person could be on a number of different lists waiting for different conditions – i.e. a single patient could be on more than one pathway. Due to the RTT dataset being an aggregate data collection it is not possible to measure the number of unique patients. Therefore the term ‘patient pathways’ is used, to better reflect the fact that one person can be on multiple waiting lists. The methodology used to measure and calculate these statistics has not changed. This is also more consistent with the other nations of the UK in their reporting of RTT.
For more information, please visit StatsWales.
The RTT dataset is used in figure 1, 2 and 3 on the ‘System ability to respond’ page.
The Emergency Department Data Set (EDDS)
The Emergency Department Data Set (EDDS) captures attendances at Accident & Emergency departments and Minor Injury Units (MIUs) in Welsh hospitals.
Velindre NHS Trust does not provide EDDS data as there are no A&E departments or MIUs in the Trust.
During the COVID-19 pandemic, several Minor Injury Units temporarily closed, but some have since reopened. These are Barry hospital (closed in March 2020; reopened in August 2020); Bryn Beryl (closed in May 2020; reopened in August 2020); Dolgellau and Barmouth District Hospital (closed in April 2020; remains closed); Tywyn & District War Memorial Hospital (closed in June 2020; remains closed); and Llandovery (closed in April 2020; remains closed).
For more information, please visit StatsWales.
The EDDS dataset is used in figure 4 and 5 on the ‘System ability to respond’ page.
Welsh Ambulance Service Trust (WAST)
Emergency ambulance services are commissioned by the seven Local Health Boards on behalf of the people of Wales through the Emergency Ambulance Service Committee (EASC). Emergency ambulance services for the population of Wales and anyone visiting Wales, are delivered by the Welsh Ambulance Services NHS Trust (WAST). EASC has developed a set of Ambulance Quality Indicators to monitor and improve performance across the 5 Step Ambulance Care Pathway: Help Me Choose; Answer My Call; Come To See Me; Give Me Treatment and Take Me To Hospital.
Data is submitted by Welsh Ambulance Services NHS Trust Digital Services and exported to a further Excel spreadsheet.
Our indicator uses data for AQI21, which measures the amount of lost hours following notification to handover over 15 minutes.
Further information on ambulance service indicators can be found here.
The WAST dataset is used in figure 6 on the ‘System ability to respond’ page.
Patient Episode Database for Wales (PEDW)
The Patient Episode Database for Wales (PEDW) comprises records of all episodes of inpatient and day case activity in NHS Wales hospitals. Hospital activity for Welsh residents treated in other UK nations (primarily England) is also included. The data is collected and coded at each hospital. The records are then electronically transferred to Digital Health Care in Wales, who validate and merge into the main database.
From 2019/20 onward, due to the Covid-19 pandemic, there was a reduction in both emergency and elective admissions.
Useful links
The PEDW dataset is used in figure 7 and 8 on the ‘System ability to respond’ page.
Welsh Laboratory Information Management System (WLIMS)
WLIMS is a clinical IT system used by pathology staff across Wales for storing, recording and exchanging information such as blood test results. The system also links to the machines which conduct the tests and analyse the samples. The system is linked to analysers which are used to produce the majority of tests within laboratories.
This experimental analysis examines the monthly count of individual patients with a pathology sample indicating a primary malignant tumour (excluding NMSC) in Wales for all malignancies.
Further data on cancer reporting can be found here, and a technical guide with a full description of the methodology can be found here.
The WLIMS dataset is used in figure 9 on the ‘System ability to respond’ page.
Public Health Mortality
Public Health Mortality (PHM) is a dataset containing each individual death of a resident that is registered in the particular year. Individual records for death registrations are sent on a weekly basis from registrars’ offices across England and Wales to the Office for National Statistics (ONS). The ONS collates and validates the data. The data are based on the underlying cause of death e.g. if an individual dies from pneumonia but had been made vulnerable to that disease by end-stage cancer, then cancer (rather than pneumonia) is recorded as the underlying cause of death.
There have been revisions to the manner in which the death certificates are translated by the ONS into International Classification of Diseases codes (10th revision). These changes mean that unrevised data are not comparable across years. The main change relates to the rules that govern which cause of death detailed on the death certificate is selected as the underlying cause. Comparability ratios have not been used in these analyses and therefore caution should be exercised when interpreting trends.
Cause of death is based on the medical certificate of cause of death. This is completed by the certifying doctor for about three quarters of deaths and by a coroner for the remainder. Most of the deaths certified by a coroner do not involve an inquest or any suspicion of violence, but are referred to the coroner because they were sudden and unexpected, or because there was no doctor in attendance during the deceased’s last illness. There will be a long delay in registering a small number of deaths for which a coroner’s ruling is required e.g. suicide, homicide, undetermined intent.
The PHM dataset is used in figures 1-9 on the ‘Excess mortality’ page.
University College London Tobacco Research Group
The smoking prevalence indicator uses data from the Smoking Toolkit Study (STS) provided by the University College London Tobacco & Alcohol Research Group (UTARG).
The STS consist of monthly population-based surveys with 12-month-follow-ups by telephone. Each month a new sample of roughly 300 people aged 16+ years residing in Wales is interviewed. Please note that due to the pandemic, the data collection changed from face-to-face to telephone interviews and, between April 2020-December 2021, only adults aged 18 and over were interviewed. Samples are weighted to match the population in Wales on key socio-demographics.
Further information on UTARG can be found here and their smoking in Wales output can be found here.
The STS dataset is used in figure 1 on the ‘Healthy behaviours and wellbeing’ page.
Kantar data
Our alcohol and fruit and vegetable consumption indicators use data supplied by Kantar. Further information on Kantar can be found here.
Fruit and vegetable consumption
The fruit and vegetable consumption indicator uses data from their Worldpanel Usage Foods dataset. The Worldpanel Usage Foods service consists of the collection of market research data from a panel of 11,000 individuals in 4,000 households whereby estimates of consumer expenditure are derived from the data collected. The estimates of consumer expenditure data gathered, is organised over a fifty-two (52) week reporting period.
Methodology
The Usage service tracks the in home/carried out consumption of individuals across the UK. Panelists fill an online diary close to the moment of consumption for 7 days at a time, four times a year, giving a sample of over 40,000 weekly diaries (~11,000 individuals).
They are asked to report on every food and drinks categories each individuals in the household have consumed every day of the week across 7 different occasions (Breakfast, Morning Snacks, Lunch, Afternoon Snacks, Teatime, Evening Meal and Evening Snacks). The methodology does not allow for tracking the actual portion size of the fruit/vegetable consumed each time so in this report, we take the assumption that panelists consume the right amount to account towards a portion of their 5-a-day
The panel is weighted to be representative of the UK population (based on age/gender, presence of kids in the household etc.)
Categories included in this report:
Fresh fruits and vegetables
Frozen fruits and vegetables
Ambient fruits and vegetables
Fresh and ambient soup (excl. dried/packet soup)
Pure Juice (Fresh and Ambient) - excluding Juice from concentrate
Exclusions:
Potatoes - as they don't count towards 1 of your 5-a-day
Herbs
Chillies
Lemon & Lime
Garlic & Ginger
This is because portion sizes are very unlikely to meet the required amount to count towards one of your 5-a-day
Product categories such as snack bars, ready meals etc which may include a portion of your 5-a-day but do not inherently/always contain a portion of fruit or veg. Any Food/drink bought out of home and consumed out of home will also be excluded.
Alcohol consumption
The alcohol consumption indicator uses data from the Alcovision dataset. The Alcovision service consists of the collection of market research data from a panel of 30,000 individuals whereby estimates of consumer expenditure are derived from the data collected. The estimates of consumer expenditure data gathered, is organised over a three month reporting period.
A drink is defined as a single glass of wine, bottle of beer, measure of spirits, etc
The Kantar dataset is used in figure 2, 3, 4 and 5 on the ‘Healthy behaviours and wellbeing’ page.
National Survey for Wales (NSW):
The NSW involves around 12,000 people each year and covers a broad range of topics. The main purpose is to provide information on the views and behaviours of adults in Wales.
Data presented in the tool is by financial year, although presented in the trend tab, direct comparisons over time are not possible due to the significant change in methodology each year. Additionally, not all questions were asked during each survey period.
Useful links
The NSW dataset is used in figure 6 on the ‘Healthy behaviours and wellbeing’ page.
Public Engagement Survey (PES)
The physical activity trend indicator uses data from the 2016-2020 National Survey for Wales to establish a pre-pandemic average for comparison against responses from the Public Health Wales Public Engagement Survey.
During the COVID-19 pandemic, Public Health Wales conducted interviews with hundreds of people aged 18 or over across Wales, to understand how COVID-19 and the measures being used to prevent its spread are affecting the physical, mental and social wellbeing of people in Wales.
The survey was conducted by telephone, and asked members of the public in Wales how coronavirus and related control measures are affecting their health and wellbeing. The information collected from 500 or more randomly selected individuals provides the basis of the results presented in each weekly report. The survey aims to provide data representative of the Welsh population and data are adjusted to represent the Welsh population by age, sex and deprivation.
Further information on the PES can be found here.
The PES dataset is used in figure 6 on the ‘Healthy behaviours and wellbeing’ page.
Time to Talk Public Health (PHW)
The latest available data for physical activity indicator uses data from the Public Health Wales Time to Talk Public Health Panel.
Time to Talk Public Health is a national panel of Welsh residents aged 16+ years established by Public Health Wales to enable regular public engagement to inform public health policy and practice. The panel is designed to be broadly representative of the Welsh population by age, sex, deprivation, ethnicity and health board. Members of the public are recruited to the panel using a variety of methods and subsequently invited to participate in regular surveys to provide insight into key public health issues.
An initial target of 2,500 panel members was set in order to obtain a monthly survey sample of approximately 1,000 responses, with response rates to alternate month surveys estimated to be a maximum of 50%.
Panel members are invited to participate in a 15-20 minute survey every month. The surveys will ask about current public health issues that may impact the health of the community of Wales.
Surveys can be completed in one of two ways:
Online: by receiving a personalised link to a survey via email each month.
Telephone: with a trained interviewer from DJS Research calling you each month at a time convenient to you.
Further information on the panel can be found here.
The dataset is used in figure 7 on the ‘Healthy behaviours and wellbeing’ page.
Annual Population Survey (APS), ONS
The APS is a continuous household survey, covering the UK, with the aim of providing estimates between censuses of main social and labour market variables at a local area level. The APS is not a stand-alone survey, but uses data combined from two waves of the main Labour Force Survey (LFS) with data collected on a local sample boost. Apart from employment and unemployment, the topics covered in the survey include housing, ethnicity, religion, health and education.
The datasets comprise 12 months of survey data. The achieved sample size is approximately 320,000 respondents.
The APS is used to estimate a pre-pandemic comparator for:
- Persons reporting high levels of anxiety
- Persons reporting low life satisfaction
- Persons reporting low levels of happiness
- Persons reporting low levels of feeling worthwhile
Further information on the APS can be found here.
The APS dataset is used in figure 8, 9, 10 and 11 on the ‘Healthy behaviours and wellbeing’ page.
Opinions and Lifestyle Survey (OPN) and opinions and social trends, ONS
Opinions and Lifestyle Survey
The survey is currently a fortnightly survey with a focus on collecting information on health, including the impact of the coronavirus (COVID-19) pandemic on households and individuals in Great Britain, as well as a range of other topics such as people's experiences regarding cost of living and shortages of goods. The questions are primarily requested by government departments, as well as by universities and charities.
The Opinions and Lifestyle Survey (OPN) provides rapid answers to questions of immediate policy interest, helping to measure public awareness of new policies.
Topics that have been requested include:
-
physical and mental health measures
-
well-being
-
loneliness
-
experiences of crime
-
attitudes to climate change
-
public understanding of government publicity and information campaigns related to the coronavirus pandemic
-
whether people are adhering to the latest guidance relating to the coronavirus pandemic
-
attitudes to vaccines and mass testing
-
how the pandemic has affected people's work and education
More information on the OPN, including the methodology and quality, can be found here.
Public opinions and social trends
The public opinions and social trends data is created using data from the ONS OPN dataset. More information can be found on one of the release bulletins, such as the one found here.
The OPN dataset is used in figures 8-13 on the ‘Healthy behaviours and wellbeing’ page and in figure 3 and 4 on the 'Wider Determinants' page.
Pay As You Earn Real Time Information seasonally adjusted (PAYE)
As Pay As You Earn (PAYE RTI) data cover the whole employee population (for those paid through PAYE), rather than a sample, they can be used to produce more precise and detailed statistics on pay and employment than the current survey-based statistics. Conversely, the statistics that can be produced from PAYE data are limited by the data that the PAYE system collects and rules under which it operates. While the Office for National Statistics (ONS) uses International Labour Organisation (ILO) definitions for its survey-based statistics, these cannot be adhered to so precisely using PAYE data, which are primarily collected for tax purposes.
More information on PAYE data, including the methodology and quality, can be found here.
The PAYE dataset is used in figure 1 and 2 on the ‘Wider Determinants’ page.
Consumer Prices Index including owner occupiers' housing costs (CPIH)
Consumer Prices Index including owner occupiers' housing costs (CPIH) is the most comprehensive measure of inflation. It extends the Consumer Prices Index (CPI) to include a measure of the costs associated with owning, maintaining and living in one's own home, known as owner occupiers' housing costs (OOH), along with Council Tax. Both are significant expenses for many households and are not included in the CPI.
The PAYE dataset is used in figure 1 on the ‘Wider Determinants’ page.
Labour Force Survey (LFS)
The Labour Force Survey (LFS) is a study conducted by the Office for National Statistics (ONS) that looks at the employment circumstances of the UK population. The LFS is the largest study in the UK and provides the official measures of employment and unemployment.
The survey is conducted either face-to-face or over the telephone and collects information on the circumstances of the whole household on a range of topics such as health, employment status and education/training opportunities.
For more information on the LFS, click here
The LFS dataset is used in figure 5, 6, 7 and 8 on the ‘Wider Determinants’ page.
Personal Independence Payment (PIP) clearances
Personal Independence Payment (PIP) helps with some of the extra costs caused by long-term ill-health or a disability if you’re aged 16 to 64. PIP started to replace Disability Living Allowance (DLA) for people aged 16 to 64 from 8 April 2013. New claims refer to an individual who was not previously a recipient of DLA and has made a new claim for PIP. Normal Rules does not refer to any Special Rules for End of Life.
Please note that a revision has taken place in June 2018 to correctly categorise the ages of PIP claimants at clearance for people aged 66-69, who were previously showing as having Unknown or missing age.
Further information on the PIP clearances data can be found on the Stat-Xplore site. Please note you may need to create a login.
The PIP dataset is used in figure 9 on the ‘Wider determinants’ page.
Other key data sources:
Welsh Index of Multiple Deprivation 2019 (WIMD) (used to calculate fifths of deprivations). It is the Welsh Government’s official measure of relative deprivation for small areas in Wales. It is made up of eight separate domains/types of deprivation.
ONS Mid-year estimates (MYE) are the official source of population sizes, produced annually, covering populations of local authorities, counties, regions and countries of the UK by age and sex. This data source is used as the denominator when calculating crude and age-standardised rates.
Please find guidance on how to interpret the following terms used in the tool:
Confidence intervals are indications of the natural variation that would be expected around a rate and they should be considered when assessing or interpreting a rate. The size of the confidence interval is dependent on the number of events occurring and the size of the population from which the events came. Generally speaking, rates based on small numbers of events and small populations are likely to have wider confidence intervals. Conversely, rates based on large populations are likely to have narrower confidence intervals. In the PHOF reporting tool we use 95 per cent confidence intervals. This represents a range of values that we can be 95 per cent confident contains the ‘true’ underlying rate. Comparisons are often made between two or more estimates, for example between different areas or time periods (Figure 1). Sometimes in such cases statistical testing is undertaken by comparing the confidence intervals of the estimates to see if they overlap. Non-overlapping confidence intervals are considered as statistically significantly different (Figures 1a & 1b). Whilst it is safe to assume that non-overlapping confidence intervals indicate a statistically significant difference, it is not always the case that overlapping confidence intervals do not (Figure 1c). A more exact approach is to calculate the ratio of the two estimates, or the difference between them, and construct a test or confidence interval based on that statistic. Such methods are not covered in this technical guide, but can be found in a standard textbook.
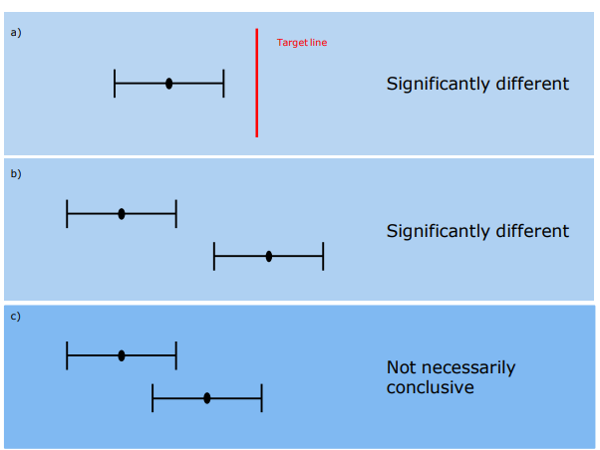
Figure 1. Using confidence intervals for making comparisons a) & b) Non- overlapping confidence intervals are considered as statistically significant c) Overlapping confidence intervals do not always indicate a difference that is not statistically significant
- Local and national deprivation fifths
The Welsh Index of Multiple Deprivation (WIMD) is an official measure of relative deprivation for small areas in Wales and a National Statistic. It identifies areas with the highest concentrations of deprivation. Ranking these areas, and dividing them into five equally sized groups produces fifths of deprivation.
For all national level analysis and most of the analysis at health board and local authority, fifths are calculated at the Wales level (national fifths). There are some indicators where local fifths are used, specifically the life expectancy and healthy life expectancy. Local fifths differ from the national fifths in that the five equal bands of deprivation are recalculated just for the small areas within each health board and local authority boundary, rather than inheriting the national fifths. This is useful for a more localised approach to producing health expectancies.
- Revised European Standard Population 2013 is a hypothetical population structure used in the weighting of mortality or incidence data to produce age-standardised rates (ASR’s).
This accessibility statement applies to the Wales Public Health Rapid Overview Dashboard.
This is run by Public Health Wales. We want as many people as possible to be able to use this website. For example, that means you should be able to:
- zoom in up to 300% without the text spilling off the screen
- navigate most of the website using just a keyboard
- navigate most of the website using speech recognition software
- listen to most of the website using a screen reader (including the most recent versions of JAWS, NVDA and VoiceOver).
We have also made the website text as simple as possible to understand. AbilityNet has advice on making your device easier to use if you have a disability.
Accessibility on this website is guided by government standards and the Web Content Accessibility Guidelines (WCAG). WCAG are widely accepted as the international standard for accessibility on the web.
Whilst we aim to make this website accessible to all users and achieve a WCAG conformance level 'AA'; we continually work with stakeholders to ensure that conformance level 'A' is adhered to as a minimum.
The Recite Me translation and text-to-speech features on this website are automated. There may be inaccuracies and inconsistencies in the translations. The official text is the English/Welsh version of the website. If you experience any accessibility issues on this site or have any comment, please contact us.
How accessible this website is
Version 1, published 08/12/2023
We know some parts of this website are not fully accessible:
- Parts of some pages may not work well with Assistive Technologies such as screen readers
- Some buttons and links do not have accessible descriptions
- Some pages are not fully usable with the keyboard
- Some pages have an illogical focus order
Feedback and contact information
If you need information on this website in a different format like accessible PDF, large print, easy read, audio recording or braille, please contact us in the first instance and we will pass your request onto the relevant team. We will consider your request and get back to you in 10 working days.
Reporting accessibility problems with this website
We are always looking to improve the accessibility of this website. If you find any problems not listed on this page or think we are not meeting accessibility requirements, please contact us.
Enforcement procedure
The Equality and Human Rights Commission (EHRC) is responsible for enforcing the Public Sector Bodies (Websites and Mobile Applications) (No. 2) Accessibility Regulations 2018 (the ‘accessibility regulations’). If you are not happy with how we respond to your complaint, contact the Equality Advisory and Support Service (EASS).
Technical information about this website's accessibility
Public Health Wales is committed to making its website accessible, in accordance with the Public Sector Bodies (Websites and Mobile Applications) (No. 2) Accessibility Regulations 2018.
Compliance status
This website is partially compliant with the Web Content Accessibility Guidelines version 2.2 standard, due to the non-compliances and exemptions listed below.
Non-accessible content
The content listed below is non-accessible for the following reasons.
Non-compliance with the accessibility regulations
Version 1, published 08/12/2023
Whilst we endeavour to meet ‘WCAG 2.2’ we currently have the following non-compliance issues:
1.3 Adaptable
1.3.1 Info and Relationships
1.3.2 Meaningful Sequence
1.3.3 Sensory Characteristics
1.3.4 Orientation
1.3.5 Identify Input Purpose
1.4 Distinguishable
1.4.1 Use of Colour
1.4.3 Contrast (Minimum)
1.4.8 Visual Presentation
1.4.12 Text Spacing
1.4.13 Content on Hover or Focus
2.1 Keyboard Accessible
2.1.1 Keyboard
2.4 Navigable
2.4.3 Focus Order
2.4.4 Link Purpose
2.4.6 Headings and Labels
2.3.13 Focus Appearance
3.1 Readable
3.1.1 Language of Page
3.1.4 Abbreviations
4.1 Compatible
4.1.2 Name, Role and Value
Preparation of this accessibility statement
This statement was prepared in November 2023. It will be reviewed in November 2025.
This website was last tested in November 2023 by ourselves using the FastPass Accessibility Insights for Web extension.