A summary of trends in risk factors for non-communicable diseases
Author: Rhys Powell, Publichealthwalesobservatory@wales.nhs.uk
Many thanks for providing additional evidence and comments to: Clare Withey, Scott Wright, Rhian Hughes, Louisa Nolan, Nathan Lester, Llion Davies, Chris Emmerson, Mary-Ann McKibben, Lorna Bennett, Ilona Johnson, Helen Erswell, Paul Pilkington
Date published: 26 February 2025
1. Purpose
The focus of this article is on the risk factors for chronic diseases. This article is the third in our series of articles looking at trends and projections for some of the most prevalent chronic diseases in Wales. We present these together, as the risk factors are often common across more than one chronic disease. As well as an overview of the trends, this article also summarises work taking place to tackle the modifiable risk factors.
Understanding disease risk factors is essential for creating effective public health strategies, promoting healthier behaviours and improving health outcomes. This article considers risk factors associated with poor health and wellbeing with a primary focus on obesity. As well as improving general wellbeing, improvements in these behaviours could also lead to a reduction in the prevalence of some chronic diseases, such as diabetes, cardiovascular disease and respiratory disease. It could also potentially reduce the likelihood of developing certain cancers (Gunter et al. 2024).
This article reports observed percentages without adjusting for changes in age structure. Age standardised percentages would provide fairer comparisons over time, especially for age-influenced behaviours and will be added to data downloads later. Currently, observed percentages are presented to highlight their direct impact on services and planning since they represent the actual percentage in the population.
We anticipate that this series of articles will be useful to planners and decision-makers, and indeed anyone who is interested in future projections of disease, and their underlying risk factors.
All the data from this article together with some additional breakdowns can be downloaded.
The articles in the series include:
- Prevalence of disease homepage
- Diabetes prevalence – trends, risk factors, and 10-year projection (November 2023)
- A summary of prevalence of chronic disease and cancer incidence in Wales trends and 10-year projections (December 2024)
- A summary of trends in risk factors for chronic diseases
- Cardiovascular disease prevalence – trends, risk factors, and 10-year projections
- Respiratory disease
- Musculoskeletal disease
- Cancer
- Smoking scenarios
- Mental health
2. Headlines
- The prevalence of adults living with obesity in Wales has increased by 44% in the last 20 years. (National Survey for Wales (2016/17 - 2022/23), Welsh Government).
- Since 2003/04, the prevalence of adults living with obesity has increased from just under 1 in 5 people, to a little over 1 in 4 people in 2022/23 (Welsh Health Survey, 2003/04 – 2015/16, National Survey for Wales 2016/17 - 2022/23, Welsh Government).
- The prevalence of children aged 4-5 living with obesity has fluctuated at around 11 to 12 percent since 2013/14, with a reported 11.4% living with obesity in 2022/23 (Child Measurement Programme, Public Health Wales).
- Guidance from Public Health England estimated that in 2014/15, overweight and obesity related ill health cost the UK-wide NHS £6.1 billion, with a wider societal cost of £27 billion.
- These figures are projected to increase to £9.7 billion and £49.9 billion respectively by 2050.
- Unhealthy behaviours including poor diet, alcohol consumption and physical inactivity are not improving. The reductions in prevalence of smoking have slowed down.
- Unhealthy behaviours are generally higher in more deprived areas, except for alcohol consumption.
- Although individuals living in the most deprived areas may consume less alcohol, they tend to suffer worse health outcomes (Lewer et al., 2016).
- A multi-pronged approach encompassing education, programmes, services and legislation were successful in reducing the prevalence of smoking. However, this is yet to be replicated to the same extent for other risks factors, such as living with obesity.
Contents
1. Purpose
2. Headlines
3. Summary
3.1 Technical definitions and Chief Medical Officer Guidelines
4. Obesity
4.1 Living with obesity and non-communicable disease
4.2 The costs of living with obesity and overweight
5. Diet and the obesogenic environment
5.1 Economic Factors
5.2 Environmental factors
6. Physical activity
7. Alcohol consumption
8. Smoking
9. Air quality
10. What could be done
11. An overview of services, programmes, prevention services and legislation in Wales
11.1 Programmes
11.2 Services
11.3 Prevention
11.4 Legislation
12. Data quality and interpretation
12.1 Self-reported survey data
12.2 Welsh Health Survey
12.3 National Survey for Wales
12.4 The School Health Research Network Survey
12.5 Child Measurement Programme for Wales
12.6 Air quality
13. Download the data
13.1 Download the data in this article – Excel
13.2 Download the data from this article with additional breakdowns - CSV
3. Summary
This section contains a high-level overview of chronic disease risk factor prevalence in Wales. Sections 4 to 9 explore the data in more detail.
Risk factors can be broadly categorised into modifiable and non-modifiable. Modifiable risk factors may be directly within an individual’s control, such as physical activity. They may also be affected by local or national government policy, decisions or legislative change. Public health prevention and health improvement focuses primarily on these modifiable risk factors, and this is our focus in this article.
Prevalence of disease is also affected by non-modifiable risk factors, such as age, sex and ethnicity. The impact of these differs across different diseases. Although these are not modifiable, it is useful to understand the variation, when thinking about planning services, or planning engagement with affected populations. For example, population screening programmes target specific age ranges. These non-modifiable risk factors are not in scope for this article but will be considered in the disease-specific articles in this series.
Overall, unhealthy behaviours like physical inactivity, high alcohol consumption and low fruit and vegetable consumption have not shown much improvement since 2020/21 (Table 1), our earliest comparative data point. Improvements to smoking prevalence have slowed in recent years.
Percentage of adults aged 16+ in Wales reporting health behaviours
| Health behaviour | 2020/21 quarter 4 January-March 2021 | 2022/23 |
|---|---|---|
| Living with obesity | 24 | 26 |
| Ate no fruit and vegetable portions the previous day | 6 | 7 |
| Ate at least 5 fruit and vegetable portions the previous day | 31 | 29 |
| Physically active less than 30 minutes in the previous week | 32 | 31 |
| Physically active at least 150 minutes in the previous week | 51 | 55 |
| Average weekly alcohol consumption none | 20 | 17 |
| Average weekly alcohol consumption above guidelines | 17 | 17 |
| Current smoker | 14 | 13 |
Table 1: Healthy behaviours have shown little improvement in recent years, with most physical activity and smoking being the only ones seeing an improvement. However, it should be noted that none of the changes are statistically significant. Note 1: Survey paused in March 2020 due to COVID-19. (National Survey for Wales, observed percentage, 2016/17 - 2022/23, Welsh Government)
There is a significant and persistent gap in the prevalence of those having obesity and of most unhealthy behaviours between people living in the most and least deprived areas in Wales (Figures 1 and 2 respectively). The only exception to this is alcohol consumption.
Percentage of adults aged 16+ who self-report as living with obesity in the most and least deprived fifths of areas in Wales
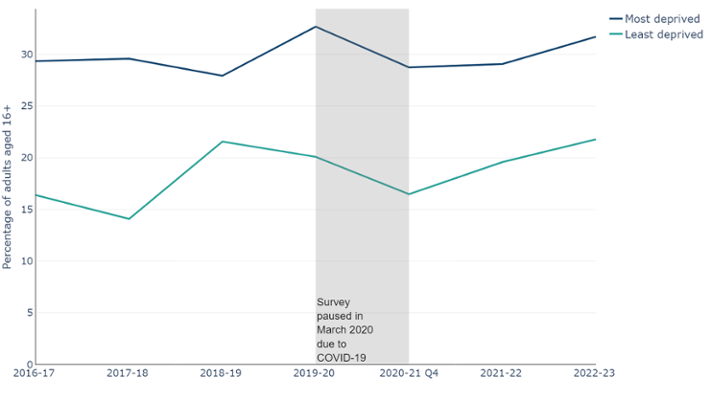
Figure 1: Adults living in the most deprived fifth of areas in Wales are about 50% more likely to be living with obesity than those in the least deprived fifth, with roughly 1 in 3 people living with obesity (National Survey for Wales, observed percentage, 2016/17 - 22/23, Welsh Government)
Percentage of adults living in the most and least deprived fifth of areas in Wales reporting unhealthy behaviours
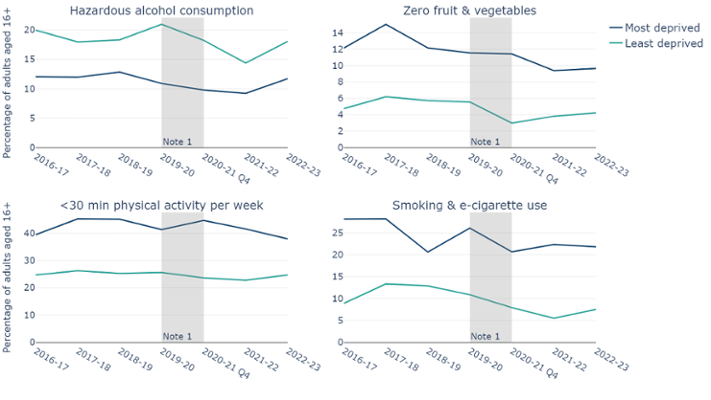
Figure 2: Higher levels of unhealthy behaviours are reported in the most deprived areas compared to the least deprived areas, except for alcohol consumption. Top left chart shows alcohol consumption at hazardous levels, top right chart shows adults consuming zero fruit and vegetables in the previous day, bottom left chart shows adults being physically active for fewer than 30 minutes in the previous week and bottom right shows adults reporting to smoke or use e-cigarettes. Note 1: Survey paused in March 2020 due to COVID-19. (National Survey for Wales, observed percentage, 2016/17 - 2022/23, Welsh Government)
3.1 Technical definitions and Chief Medical Officer Guidelines
Obesity
Obesity is measured using Body Mass Index (BMI), which is estimated by dividing an adult’s weight, by their height in metres squared. Living with overweight is defined as having a BMI of 25 up to 30. Living with obesity is defined as a BMI of 30 or more. BMI risk thresholds vary between ethnic groups. The figures above are based on the risk threshold for the white population.
Physical activity
The UK Chief Medical Officer guidelines are that adults should be moderately active for at least 150 minutes per week.
Diet
The Chief Medical Officer’s guidelines for fruit and vegetable consumption is to consume at least five portions a day. The data are for adults aged 16 years and older, reporting on the number of fruit and vegetable portions they have eaten the previous day. The data are broken down into three categories:
- No portions
- 1 or more but fewer than 5
- 5 or more.
Alcohol consumption
The Chief Medical Officer’s guidelines to keep health risks from alcohol to a low level is to not drink more than 14 units a week on a regular basis. The data are for an adult's average weekly alcohol consumption and is split into four categories:
- None
- Some (up to 14 units)
- Hazardous (over 14 to 50 units for males and over 14 to 35 units for females)
- Harmful (anything over the hazardous limits)
4. Obesity
The proportion of adults living with obesity in Wales has increased by 44% in the last 20 years, from 18% in 2003/04 to 26% in 2022/23 (Figure 3). This is a little over one in four people (Welsh Health Survey, 2003/04 – 2015/16, National Survey for Wales, 2016/17 - 2022/23, Welsh Government). Living with obesity is a key risk factor for several chronic diseases. It is acknowledged that changes in the survey methodology over the years increases the uncertainty in the comparison of data points across the time series. However, it is still clear that there is a strong increasing trend in the prevalence of living with obesity in Wales. This trend does not show signs of slowing.
Percentage of adults aged 16+ by reported BMI category
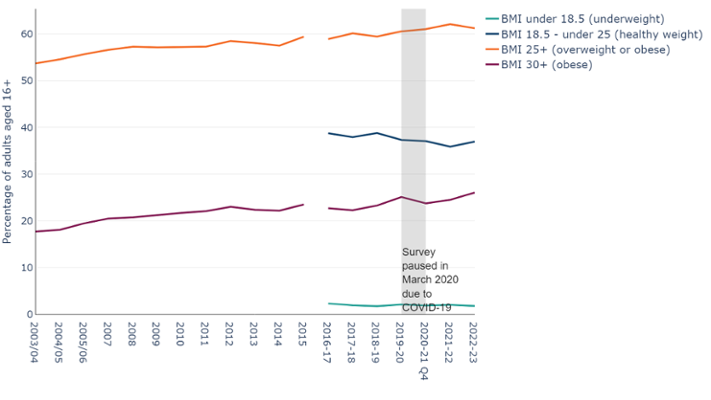
Figure 3: The percentage of adults aged 16 years or older in Wales living with obesity has increased by 44% in the last 20 years, from 18% in 2003/04 to 26% in 2022/23 (Welsh Health Survey, observed percentage, 2003/04 – 2015/16, National Survey for Wales, observed percentage, 2016/17 - 2022/23, Welsh Government).
The latest Child Measurement Programme (2022/23 academic year) recorded 11.4% of children aged 4-5 years as living with obesity. This is statistically significantly lower than pre-pandemic, however, it is still a little over 1 in 10 children (Child Measurement Programme, Public Health Wales).
The BMI and weight classification for children is different to those for adults. Whilst adults BMI is categorised by set intervals, each child’s BMI is calculated and then assessed against a reference population or growth reference derived from the measurements of a large sample of children of the same age and sex. This reference scale is divided into 100 units, known as centiles. The centile the child’s BMI falls within will be their weight classification. For a child to be classed as living with obesity, their BMI must be in the 95th centile or above. For more information, please see the CMP technical document.
Adults living in the most deprived fifth of areas in Wales are about 50% more likely to be living with obesity than those in the least deprived fifth, with roughly 1 in 3 people living with obesity (Figure 1) (National Survey for Wales, 2022/23, Welsh Government). Since 2020/21, more females report living with obesity than males (Figure 4) (National Survey for Wales, 2020/21 – 2022/23, Welsh Government).
Data from other United Kingdom nations are not comparable as English and Scottish surveys use trained staff to measure participants consistently, while Wales and Northern Ireland use self-reported responses to survey questionnaires (Table 2). Self-reported weight tends to underestimate true weight. Analysis by Nesta estimated adjustments for this difference in reporting, and found that Wales could potentially have the highest rates of adults living with obesity in the United Kingdom.
Percentage of adults aged 16+ living with obesity aged 16+ in United Kingdom nations
| Nation | Percentage of adults having obesity | Year | Source | Method |
|---|---|---|---|---|
| Scotland | 32 | 2023 | Scottish Health Survey | Measured |
| England | 29 | 2022 | Health Survey for England | Measured |
| Wales | 26 | 2022/23 | National Survey for Wales | Self-reported |
| Northern Ireland | 24 | 2023/24 | Health Survey Northern Ireland | Self-reported |
Table 2: A table showing the reported percentage of adults living with obesity in each United Kingdom nation, when they were reported and links to the relevant data source.
Percentage of adults aged 16+ living with obesity in Wales by sex
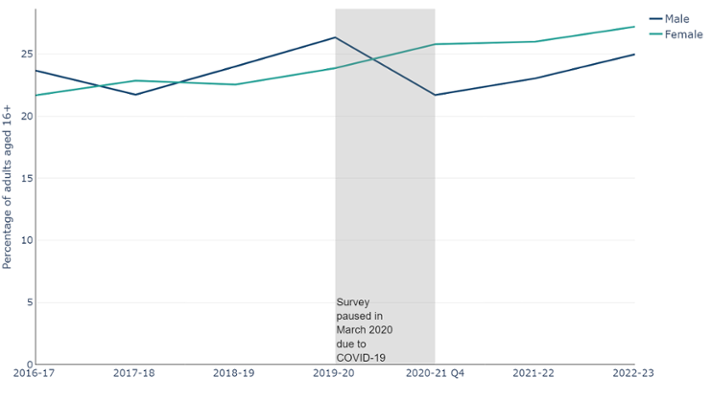
Figure 4: Percentage of males and females aged 16+ years living with obesity. Although there was a decrease in the percentage of males living with obesity in 2020-21, this may be due to methods changes implemented during COVID-19. The percentage of people living with obesity in both sexes has been increasing since 2020/21 (National Survey for Wales, observed percentage, 2016/17 - 2021/22, Welsh Government)
According to data from the Organisation for Economic Co-operation and Development (OECD), the UK reports one of the highest proportions of population who are living with obesity within the G7 (Table 3). Only the United States of America consistently reports higher levels. The United Kingdom proportion is based on data from England, however, the percentage of adults living with obesity in Wales is only slightly lower than England (see Table 2). Furthermore, as noted previously the Wales data are derived from self-reported measurements that are potentially an underestimate compared with the formal measurements informing the English data. Whilst hard to compare, it is clear that there is a general upward trend in prevalence of obesity across the G7 countries, with the United Kingdom above other European countries. More information on the methods from each country in this analysis are available from the OECD.
Percentage of adults aged 15+ in G7 nations self-reporting as living with obesity
| Nation | Percentage of adults having obesity | Year |
|---|---|---|
| United States | 33.8 | 2022 |
| United Kingdom | 25.9 | 2021 |
| Canada | 22.4 | 2022 |
| Germany | 16.7 | 2021 |
| France | 14.4 | 2019 |
| Italy | 11.4 | 2022 |
Table 3: The United Kingdom reports one of the highest percentages of adults living with obesity among the G7 nations, with only the United States reporting higher levels. As data are not consistently available for every country, every year, the table includes the most recent year available for each country. (Data explorer, 2010 - 2022, OECD)
Living with obesity and deprivation trends in children are similar to those for adults. Children aged 4-5 years in the most deprived areas are almost twice as likely to be living with obesity compared with those in the least deprived. (Child Measurement Programme, Public Health Wales).
Wales has the highest levels of children living with obesity in the United Kingdom (Table 4) (Child Measurement Programme, Public Health Wales). Unlike the figures for adults, the measurements for children are taken by trained staff using standardised approaches in all 4 UK Nations.
There are some differences in the age ranges of the children measured, and minor differences in the definitions of the 'Underweight' and 'Healthy weight' categories between Wales and the other UK nations. However, they do not affect the results. Data and methodology information are available via our dashboard. The age range for children measured in Wales is comparable to England and at the younger end of the range compared with Northern Ireland and Scotland. Therefore, this is unlikely to be the reason for the higher values reported in Wales.
Reported percentage of children living with obesity in United Kingdom nations
| Nation | Percentage of children having obesity | Year | Age measured |
|---|---|---|---|
| Wales | 11.4 | 2023 | 4-5 years |
| Northern Ireland | 10.7 | 2022 | 4.5 - 5.5 years |
| Scotland | 10.5 | 2022/23 | 5 years |
| England | 9.2 | 2019/20 | 4-5 years |
Table 4: Wales has the highest percentage of children living with obesity in compared with the other United Kingdom nations (Child Measurement Programme, 2023, Public Health Wales)
4.1 Living with obesity and non-communicable diseases
Figure 5 below shows how the prevalence of some diseases is consistently higher for people living with obesity compared to those who are not. There is also a higher risk of being diagnosed with certain cancers, often with a poorer prognosis and outcome.
Percentage of adults aged 16+ in Wales with a chronic condition who are living with obesity compared with those who are not
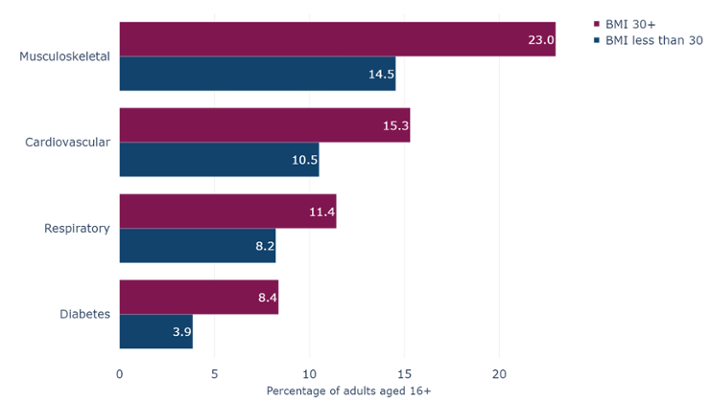
Figure 5: The prevalence of diabetes, musculoskeletal, respiratory and cardiovascular diseases are statistically significantly higher for people living with obesity compared to those that are not (National Survey for Wales, observed percentage, 2022/23, Welsh Government)
Whilst the focus here is on living with obesity, living with overweight also brings a greater risk of developing certain chronic diseases. According to the 2022/23 National Survey for Wales, 61% of adults were living with overweight or obesity. This figure has gradually increased from 54% in the first Welsh Health Survey in 2003/04 (Welsh Health Survey, 2003/04, National Survey for Wales, 2022/23, Welsh Government). This is an increase of nearly 13%, and the trend does not show signs of slowing.
4.2 The costs of living with obesity and overweight
Guidance from Public Health England estimated that overweight and obesity related ill health cost the NHS in England £6.1 billion, with a wider societal cost of £27 billion, in 2014/15. The direct costs cover the treatment of people living with overweight or obesity and obesity related diseases. The indirect costs include loss of earnings due to obesity related sickness and obesity related premature mortality.
We can make an estimate of the costs for Wales, adjusting for population size (Population estimates: mid 2023, ONS) and inflation (Bank of England’s inflation calculator, December 2024). This gives estimated costs for Wales in 2024 of around £0.5 billion and £2 billion respectively.
5. Diet and the obesogenic environment
The Chief Medical Officer’s guidelines for fruit and vegetable consumption is to consume at least five portions a day. The data is for adults aged 16 years and older, reporting on the number of fruit and vegetable portions they have eaten the previous day. It is broken down into three categories:
- No portions
- 1 or more but fewer than 5
- 5 or more
All three categories have been static in recent years. Figure 6 shows that in 2022/23, the percentage of adults that reported eating no portions of fruit and vegetables was 7%, adults eating 1 or more but fewer than 5 was 65% and eating at least five was 29%. (National Survey for Wales, Welsh Government)
Percentage of adults aged 16+ by reported fruit and vegetable consumption
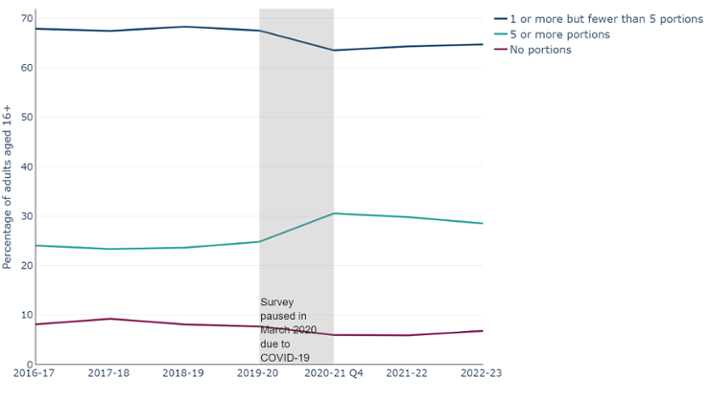
Figure 6: Percentage of adults reporting that they have eaten at least 5 portions of fruit and vegetables has increased slightly, however, those reporting that they have eaten none has stayed stable at around 7%. (National Survey for Wales, observed percentage, 2016/17 - 2022/23, Welsh Government).
In 2022/23, 1 in 10 adults living in the most deprived areas reported that they did not eat any fruit or vegetables the previous day. Only 22% of adults living in the most deprived areas reported that they ate at least five pieces of fruit and vegetables in the previous day, and only 36% in the least deprived. (National Survey for Wales, 2022/23, Welsh Government)
Whilst there is an element of personal choice with diet, it is important to consider the obesogenic environment. This refers to the role environmental factors play in determining both nutrition and physical activity.
Some examples of obesogenic environmental factors include:
- physical activity: limited access to safe spaces for exercise, sedentary jobs, reliance on cars, and increased screen time
- food environment: widespread availability of high-calorie, nutrient-poor foods, aggressive food marketing, large portion sizes, food deserts, and the high cost of healthy options.
- economic factors: income disparities, high costs of healthy living, and corporate practices prioritizing profits over health
- social and cultural influences: cultural norms prioritizing convenience, family and peer behaviours, and media promoting unhealthy foods
- policy and environment: lack of regulations on unhealthy food marketing, zoning laws favouring fast food outlets, and inadequate health education
- behavioural and psychological: stress, sleep deprivation, and habits linking food to reward or comfort
Physical activity in Wales is discussed in section 6. In this section we discuss the food environment and some economic factors.
5.1 Economic Factors
Figure 7, from The Food Foundation’s Broken Plate report, illustrates that in 2023 it was more than twice as expensive to purchase healthier food. The cost for healthier food was around £10 per 1,000 calories.
Average price of food and drink, average price (£) per 1,000kcal
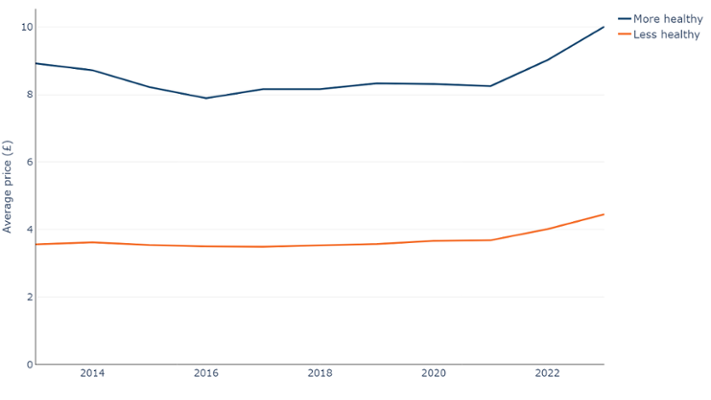
Figure 7: More healthy food has consistently cost more than less healthy food, costing at least twice as much per 1,000kcal (The Broken Plate report, 2013 - 2023, The Food Foundation)
5.2 Environmental factors
The ‘Fuel us, don’t fool us: Big food & our communities: Where are food chains expanding? (Out-ofhome #1)’ report from the Bite Back charity in 2024, conducted with the University of Cambridge, showed that 14.2% of schools in Great Britain have at least one major fast food outlet within 400m. Five out of the top 10 fast food retailers had a higher density of outlets in the most deprived areas compared to the least deprived. There has also been an increase in the number of outlets within 400m of schools (Table 5).
In 2019, Public Health Wales also performed analysis on fast food density in Wales and found there were 100.65 outlets per 100,000 people in Wales (Fast food density in Wales, Public Health Wales).
Number of fast food outlets within 400m of a school, 2014 and 2024, Great Britain
| Chain | 2014 | 2025 | Growth around schools |
|---|---|---|---|
| Subway | 979 | 1,399 | 43% |
| Greggs | 1,096 | 1,331 | 21% |
| Costa Coffee | 749 | 1,325 | 77% |
| Domino's | 585 | 939 | 61% |
| McDonald's | 517 | 565 | 9% |
| KFC | 469 | 551 | 17% |
| Starbucks | 350 | 534 | 53% |
| Pret A Manger | 167 | 327 | 96% |
| Nando's | 158 | 247 | 56% |
| Burger King | 132 | 168 | 27% |
Table 5: 7 out of 10 chains in Great Britain have increased the number of outlets within 400m of a school by at least 25%. (Out of Home report, 2024, Bite Back)
6. Physical activity
Being physically active is one way to help achieve and maintain a healthy weight. The UK Chief Medical Officer guidelines are that adults should be moderately active for at least 150 minutes per week.
Since 2016, the percentage of adults who meet this guideline has been consistently over 50%, with a peak of 56% in 2021/22 (Figure 8). (National Survey for Wales, Welsh Government).
Percentage of adults aged 16+ by reported weekly physical activity level
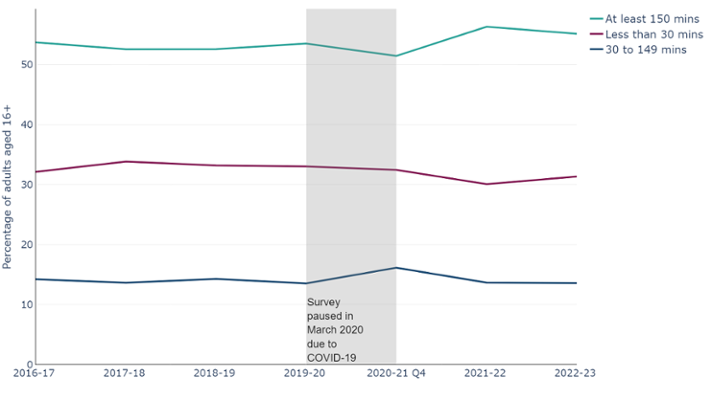
Figure 8: Reported physical activity levels have been stable, with just under one third of adults reporting that they are active fewer than 30 minutes a week (National Survey for Wales, observed percentage, 2016/17 - 2022/23, Welsh Government).
Around 60% of males and 50% of females 16 years or older reported that they met or exceeded the Chief Medical Officer’s guidelines on minimum recommended physical activity in 2022/23 (Figure 9). Although there has been some variation over time for both sexes, a higher proportion of males have consistently met the guidelines compared with females.
Percentage of males and females aged 16+ in Wales who reported meeting the recommended guidelines for physical activity
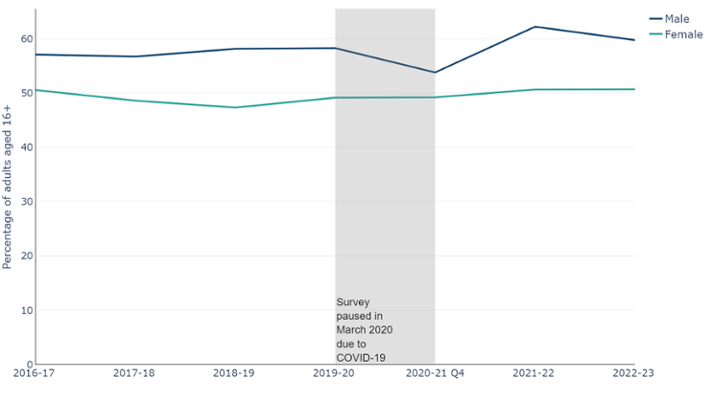
Figure 9: Between 2016-17 and 2022-23, males consistently report being more physically active than females, with nearly 60% reporting that they meet the guidelines of 150 minutes or more of moderate activity per week (National Survey for Wales, observed percentage, 2016/17-2022/23, Welsh Government).
Variations also exist across age groups, with 55% of females aged 16 to 44 years old and 70% of males aged 16 to 44 years old reporting that they were physically active for at least 150 minutes during the previous week in 2022/23. (National Survey for Wales, 2022/23, Welsh Government).
As seen in Figure 2, deprivation is also a factor, with more than one third of adults from the most deprived areas (38%) doing fewer than 30 minutes of exercise in the previous week, compared with one quarter (25%) in the least deprived areas (National Survey for Wales, 2022/23, Welsh Government).
In 2023, nearly 4 in 5 children did not meet the recommended physical activity guidelines of at least 60 minutes of physical activity every day. Only 18% reported that they meet this guideline. When split by sex, only 23% of boys and 14% of girls report that they met the recommended physical activity guidelines for children. (The School Health Research Network survey data, The School Health Research Network, date).
Higher levels of physical activity are reported in families that are more affluent, with 20% of children aged 11-16 from a ‘High’ family affluence reporting that they meet the guidelines, compared to around 15% for those from ‘Middle’ and ‘Low’ affluence families (The School Health Research Network survey data, The School Health Research Network, date).
7. Alcohol consumption
The Chief Medical Officer’s guidelines to keep health risks from alcohol to a low level is to not drink more than 14 units a week on a regular basis. The data are for an adult's average weekly alcohol consumption and are split into four categories:
- None
- Some (up to 14 units)
- Hazardous (over 14 to 50 units for males and over 14 to 35 units for females)
- Harmful (anything over the hazardous limits)
In recent years there have been slight fluctuations in the reported proportions in these categories (Figure 10). However, none of these changes have been statistically significant. The ‘None’ category, has decreased from 20% in January – March 2021 to 17% in 2022/23. In turn, the ‘Some’ category has seen a slight increase from 64% to 66% in the same period. All other categories have been static. (National Survey for Wales, Welsh Government)
Percentage of adults aged 16+ by reported average weekly alcohol consumption
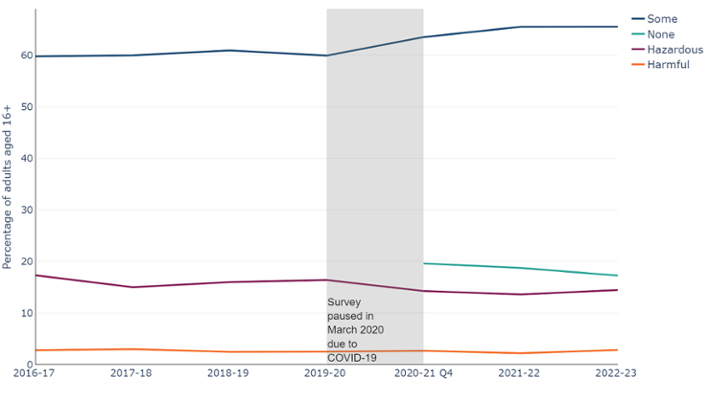
Figure 10: Reported alcohol consumption levels have been stable, with minor fluctuations, meaning the picture at a national level is not improving. Please note that the ‘None’ category begins in 2020/21 due to a definition change, previous years included ‘infrequent drinkers’. (National Survey for Wales, observed percentage, 2016/17 - 2022/23, Welsh Government).
Between 2016-17 and 2022-23, the percentage of males consuming alcohol above the guideline threshold was consistently higher than females (Figure 11). In 2022/23, 21% of males reported drinking at hazardous levels compared to 8% of females. For alcohol consumption at harmful levels, the gap was smaller, with 4% reported for females and 2% for males respectively. (National Survey for Wales, 2022/23, Welsh Government)
For all categories except ‘harmful’, alcohol consumption levels were also lower in the most deprived areas when compared to the least deprived. However, in the ‘harmful’ category, the levels were the same.
Individuals in higher socioeconomic status groups are more likely to report that they exceed recommended drinking guidelines, however, those in lower socioeconomic status groups experience more alcohol-related harm (Lewer et al., 2016). This has been termed the ‘alcohol harm paradox’.
Even where levels of alcohol consumption are similar, studies have shown that the impact of alcohol consumption on those from deprived communities results in higher levels of alcohol-related ill health. Hypotheses to explain this alcohol harm paradox include deprived drinkers suffering greater combined health challenges (e.g. smoking, obesity) that exacerbate the harmful effects of alcohol (Bellis et al. 2016).
Percentage of adults aged 16+ reporting hazardous levels of consumption of alcohol by sex
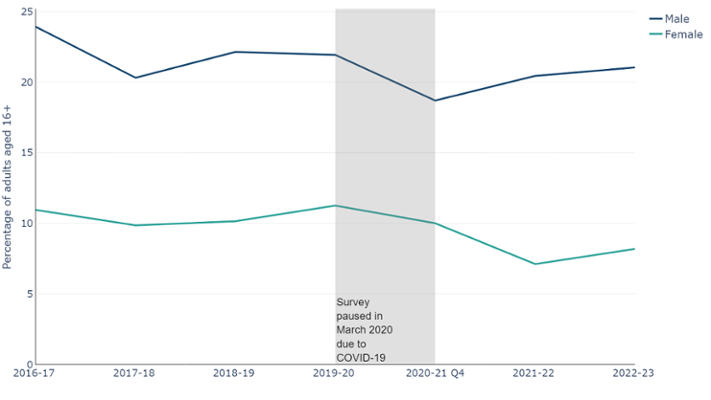
Figure 11: Males consistently consume more alcohol at a hazardous level compared to females (National Survey for Wales, observed percentage, 2016/17 - 2022/23, Welsh Government)
8. Smoking
The percentage of adults aged 16 years and over smoking in Wales has been decreasing over time (Figure 12), halving from 26% in 2003/04 to 13% 2022/23 (Welsh Health Survey, 2003/04, National Survey for Wales, 2022/23, Welsh Government). However, despite these improvements, smoking prevalence is not projected to meet the Welsh Government target of less than 5% by 2030. In 2020, Cancer Research UK released a report looking at projected smoking prevalence using the ONS Annual Population Survey. They reported that, based on current trends, Wales would reach the 5% target in 2037. To reach the target by 2030, the pace of change would need to be around 40% faster.
Percentage of adult smokers aged 16+
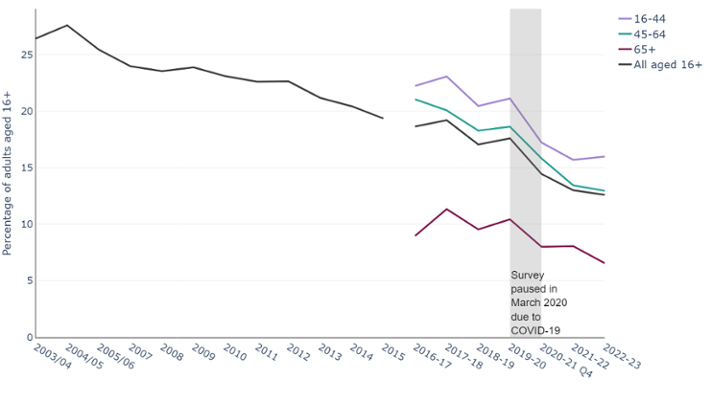
Figure 12: The percentage of adult smokers in Wales aged 16+ has decreased since 2003/04 (Welsh Health Survey, observed percentage, 2003/04 – 2015/16, National Survey for Wales, observed percentage, 2016/17 - 2021/22, Welsh Government)
According to the School Health Research Network Survey, persons aged 11-16 reporting to smoke at least once a week has remained low since 2017, dropping from 3.8% in 2017 to 2.7% in 2023 (The School Health Research Network Survey, The School Health Research Network).
If smoking rates had not changed in the past ten years, there would be more than 170,000 additional smokers aged 18 or over.
Smoking rates are typically higher in deprived areas (Figure 2). Adults living in the most deprived fifth of areas in Wales are 50% more likely to smoke compared to those living in the next most deprived quintile, and almost three times as likely to smoke as those in the least deprived areas.
The ONS Annual Population Survey has analysed the characteristics of current cigarette smokers in the UK. When looking at smoking prevalence by economic activity status in the UK in 2023, it found that those who were defined as unemployed had a higher percentage of current smokers (19.7%), compared with those who were in paid employment (11.4%) and those who were economically inactive (12.2%). People who were in ‘routine and manual’ jobs were more likely to smoke, with 20.2% reporting to smoke, compared to 7.9% of workers in ‘managerial and professional’ occupations. It also found that the higher the level of education, the less likely they were to smoke. Of people who had no qualifications, 27.4% were current smokers in 2023. Those who reported a degree or equivalent as their highest level of education had the lowest percentage of current smokers (5.8%).
According to Organisation for Economic Co-operation and Development data, the United Kingdom reports one of the lower proportions of population who are daily smokers within the G7. Although data for all countries are not available every year, between 2010 and 2022 only Canada and the United States report having a lower proportion.
Percentage of adult’s aged 15+ reporting to be a daily smoker in G7 countries
| Nation | Percentage | Year |
|---|---|---|
| France | 25.3 | 2021 |
| Italy | 19.8 | 2022 |
| Japan | 16.7 | 2019 |
| Germany | 14.6 | 2021 |
| United Kingdom | 11.2 | 2022 |
| Canada | 9.4 | 2022 |
| United States | 8.9 | 2022 |
Table 6: The United Kingdom reports one of the lowest percentages of adult daily smokers among the G7 nations. As data are not consistently available for each country, every year, the table includes the most recent year available for each country. (Data explorer, 2010 - 2022, OECD)
By using the ONS Annual Population Survey we are able to compare Wales to the other UK nations using the same data source. All four report similar levels; England has the lowest (11.6%), followed by Wales (12.6%), then Northern Ireland (13.3%) and Scotland the highest (13.5%) (Office for National Statistics, Annual Population Survey 2023).
The emerging trend in the use of vapes and any health implications from their use also needs to be monitored. Whilst less harmful than smoking, vaping is not risk free. The proportion of adults vaping is reported at 8% according to the 2022/23 National Survey for Wales. The most common reason for vaping is to help stop smoking tobacco. In 2019, 76% of current users stated that vaping was used to help stop smoking tobacco.
9. Air quality
Air quality measures estimate the concentration of small particles in the air. Inhaling these can have a serious impact on health. UK standards require the measurement of the concentration of particles with a diameter smaller than 10 micrometres (PM10) and those which are smaller than 2.5 micrometres (PM2.5) as these can have a serious effect on health. The small size of these toxins means they may enter the bloodstream and be transported around the body, lodging in the heart, brain and other organs. For comparison, a human hair is about 70 micrometres in width. The concentration of nitrogen dioxide (NO2) is another important indicator of air quality, due to its effects on health. Exposure to NO2 can harm the heart and lungs.
The Air Quality Standard Regulations 2010 set the yearly limit values for these measures as:
- NO2 to not exceed an annual mean of 40 µg/m3 in a calendar year
- PM10 to not exceed an annual mean of 40 µg/m3 in a calendar year
- PM2.5 to not exceed an annual mean of 20 µg/m3 in a calendar year
Air quality has broadly been improving since 2007. The average concentration of nitrogen dioxide (NO2) in Wales has almost halved, from a concentration of 14µg/m3 in 2007 to around 8µg/m3 in 2022. In the same period, PM10 has decreased from 16 µg/m3 to 11 µg/m3, and PM2.5 from 9 µg/m3 to 7 µg/m3 (Air Quality in Wales, Welsh Government). However, air quality can vary greatly at a local level.
Air quality in Wales, concentration (µg/m3)
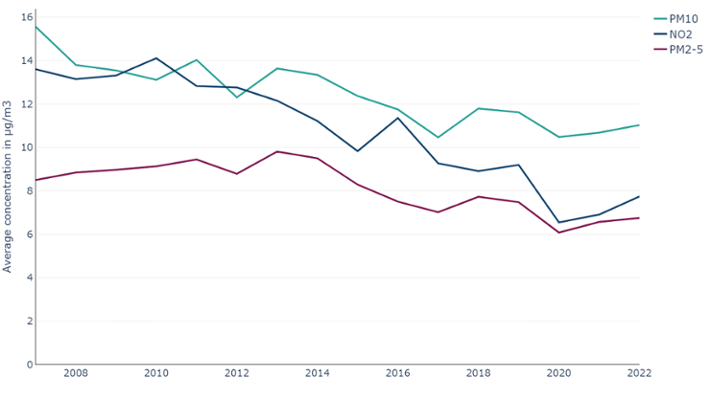
Figure 13: Air quality in Wales has been improving over time, with an overall decrease in levels of NO2, PM10 and PM2.5, with all three being below the yearly limit values at a national level. Due to the localised nature of air pollution, this adherence may vary at smaller geographies. (Air Quality in Wales, 2007-2022, Welsh Government)
The PM10, PM2.5 and NO2 air quality indicators for the Wales average all fall below the national air quality standards. However, this does not give us the whole picture, as air quality can vary significantly over local and hyper local areas. Research released by Senedd Cymru has shown Wales to have some of the worst air quality in the United Kingdom. Cardiff and Port Talbot have recorded higher levels of PM10 than Birmingham or Manchester. The Hafod-yr-ynys Road in Caerphilly recorded the highest levels of pollution outside London. In 2019, Caerphilly council began the process to purchase the properties via a compulsory purchase order in order to proceed with demolishing them. This was in part to ensure they were able to achieve compliance with the Air Quality Direction 2019 and the EU Ambient Air Quality Directive (2008/50/EC) in the shortest possible time.
10. What could be done
We see from this analysis that the prevalence of modifiable risk factors, and the gap in that prevalence between those living in the most deprived areas and those living in the least deprived areas are generally not improving as we would like. As our article on disease prevalence, cancer incidence and projections showed, without improvement there will be an increasing toll on the nation’s health, and on health and care services. This is over and above the increases in disease prevalence expected from the ageing population in Wales.
For an improved outcome, a multi-pronged approach encompassing education, programmes, services and legislation is required. The Public health: ethical issues report, released by the Nuffield council on bioethics in 2007 looked at the “intervention ladder” and found that eliminating/restricting choice and disincentives/incentives were more effective than education.
The UK has seen great success in the past with smoking prevalence. The UK is recognised as having one of the most comprehensive tobacco control policies in the world. UK legislation has included banning smoking in enclosed public places and workplaces, sales of tobacco to under 18s and mandating plain packaging for tobacco products. These have all contributed to the decline in smoking prevalence. As a result, the UK has one of the lowest rates of smoking amongst similar developed countries. Wales has been consistently innovative in tobacco control policies, becoming the first UK nation to ban smoking on hospital grounds and in cars transporting children from 2021. Help Me Quit, Wales’ free national NHS smoking cessation service treated over 16,000 smokers in 2023-24.
Replicating this approach for obesity could lead to similar success, with the result being a healthier Wales. The Welsh Government already has legislation in place to restrict the placement and price promotion of products high in fat, sugar and salt. There is also the Clean Air Plan for Wales, which as well as tackling poor air quality, looks at ways to enable and encourage active travel. This, in turn, may play a role in reducing the prevalence of people living with obesity. This legislation is an example of how it is important to address the obesogenic environment and not rely solely on improved education around the risks of living with obesity.
A recent report from Public Health Wales looked at the latest evidence on where investment in prevention can have the greatest impact, including obesity. As well as the improvements for an individual’s health, a systematic review by Masters et al in 2017 found that on average, for every £1 invested in public health, £14 would subsequently be returned to the wider health and social care economy.
11. An overview of services, programmes, prevention services and legislation in Wales
Here, we outline some of the programmes, services and guidance and legislation aimed at reducing the prevalence of some of the risk factors described in this article.
11.1 Programmes
- The All-Wales Diabetes Prevention Programme (AWDPP), funded by the Welsh Government and led by Public Health Wales, is targeted at people with an increased risk of developing Type 2 diabetes
- Healthy Weight: Healthy Wales is the Welsh Government’s delivery plan to prevent and reduce the numbers of people living with obesity
- The Help Me Quit in Hospital programme is an all-Wales smoking cessation model that aims to identify and support smokers accessing secondary care services. The model was designed by PHW in 2021/22 and is being implemented by health boards across Wales
- Reducing Smoking in Pregnancy is a national programme led by Public Health Wales working closely with Health Boards to implement improvement actions across the whole pregnancy pathway (initial assessment, during pregnancy, and at delivery), aiming to increase the number of pregnant smokers who engage with Help Me Quit for a smoke-free pregnancy
11.2 Services
- Help Me Quit was launched in 2017 and is a single brand for NHS stop smoking services in Wales. Help Me Quit is delivered by Public Health Wales and the Local Health Boards.
- The National Exercise Referral Scheme (NERS) is a Welsh Government funded health intervention incorporating physical activity and behavioural change techniques to support referred clients to make lifestyle changes to improve their health and wellbeing
11.3 Prevention
- JustB - JUSTB/BYW BYWYD is an evidence based smoking prevention programme that utilises peer influence and networks to disseminate smoke-free norms. The programme is delivered to Year 8 pupils in secondary schools with the highest smoking rates.
11.4 Legislation
- The Tobacco and Vapes Bill was introduced into the House of Commons on 5 November 2024. The Bill would make it illegal to sell tobacco products to anyone born after 1 January 2009. The Bill also includes proposals to create powers for UK and devolved administrations to extend smoke and vape-free spaces, restrict vape packaging, display and flavours and to licence tobacco and vape retail outlets.
- The Tobacco Control Programme continues to support policymakers and local partners to implement smoke-free legislation and guidance in Wales, such as supporting smoke-free hospital grounds.
- Legislation passed by Welsh Government and the other UK nations will ban disposable vapes from June 2025.
- New legislation to restrict the placement and price promotion of products high in fat, sugar and salt
- Public Health (Minimum Price for Alcohol) (Wales) Act 2018
12. Data quality and interpretation
12.1 Self-reported survey data
Data relating to lifestyle behaviours are collected through the following surveys:
- Welsh Health Survey
- National Survey for Wales
- The School Health Research Network Survey
As with all surveys, they are reliant on self-reported data, which can be affected by various sources of bias, such as social desirability, recall, or response styles. For example, people may under-report how often they consume alcohol and over report how often they exercise.
Sample sizes affect the degree of confidence with which we can report findings. Where possible, we have included 95% confidence intervals in the data downloads. This represents a range of values that we can be 95% confident contains the ‘true’ underlying rate. In general, the larger the sample size, the smaller the gap between the upper and lower confidence intervals.
This article reports observed percentages without adjusting for changes in age structure. Age standardised percentages would provide fairer comparisons over time, especially for age-influenced behaviours and will be added to data downloads later. Currently, observed percentages are presented to highlight their direct impact on services and planning since they represent the actual percentage in the population.
12.2 Welsh Health Survey
The Welsh Health Survey ran from 2003/04 to 2015 and had a target sample of 15,000. In 2016, the Welsh Health Survey was replaced with the National Survey for Wales. Archived data and technical reports are available online.
12.3 National Survey for Wales
The National Survey for Wales replaced the Welsh Health Survey in 2016. Although it is the successor to the Welsh Health Survey, they should not be compared. This is because as the survey methodology changes, we may see a step change due to this, as opposed to a natural change. For some healthy behaviours, there may also be a change in the CMO guidelines, meaning a long-term analysis is unavailable. However, while you will need to consider this step change as the methodology changes, you are still able to draw some conclusions about long-term trends. Only two analyses cover both surveys, BMI and smoking trends. The categorisation for both remains the same throughout the periods, however, there may be a small step-change between surveys that may be due to the change in survey as opposed to a natural change.
Due to the covid-19 pandemic, the National Survey for Wales had to change its usual delivery method, which consisted of a mixture of face-to-face and telephone interviews. The monthly and quarterly surveys between May 2020 and March 2021 was a large-scale, random sample telephone survey, reaching around 1,000 people a month, for a total of 12,000 over the year. From July 2021, a subsample of respondents were asked to complete an online section following the telephone section. Because of this method change, results cannot be directly compared. However, as with the change from Welsh Health Survey to National Survey for Wales, although any step-change must be considered, it does not mean that there hasn’t been an actual behavioural change following the COVID-19 pandemic. This is why considering the long-term data series is crucial. Further information on the survey methodology and technical information are available from Welsh Government.
12.4 The School Health Research Network Survey
The School Health Research Network (SHRN) administers the Student Health & Well-being Survey within secondary schools in Wales every two years. Participation rates are consistently over 90%, with 95% taking place in 2023 (200 out of 210). Since 2017, all maintained, mainstream secondary and middle schools in Wales are SHRN members. For further details on survey methodology, please see the SHRN website. This information is also available on the SHRN dashboard created in collaboration with Public Health Wales.
12.5 Child Measurement Programme for Wales
The Child Measurement Programme for Wales (CMP) collects measurements of height and weight for 4-5 year olds who attend school in and live in Wales. In the 2022/23 academic year, 29,916 children were measure out of 32,703 eligible children, a participation rate of 91.5%. The CMP was established by Welsh Government statute in 2011, and the first annual report was released in 2013. A full data quality statement is available online, as well as data via our dashboard.
12.6 Air quality
The UK monitors air quality nationally through a number of networks of monitoring stations. The network that monitors concentrations of the most well-known pollutants is called the Automatic Urban and Rural Network (AURN), which reports data hourly in near real-time on the UK-AIR website.
National statistics on air quality in the UK are also produced in April each year and provide an accessible assessment of long-term trends in air quality as measured by the AURN. In September each year, measurements from the national monitoring networks are combined with modelling outputs to form a national assessment of air quality against the limit and target values for concentrations of air pollutants set internationally and domestically. The government publishes an annual report on the results of this assessment, and the modelling data used for this report are published in an interactive map on the UK-AIR website.
Each year the UK Government’s Pollution Climate Mapping (PCM) model calculates average pollutant concentrations for each square kilometre of the UK. The model is calibrated against measurements taken from the UK’s national air quality monitoring network.
The Welsh Government has used these published data to assign a concentration of NO2, PM2.5 and PM10 to each residential dwelling in Wales based on which square kilometre of Wales it sits in.
For the 2022 update of the air quality national indicators, a methodological improvement was implemented to the way in which the dwelling weights are calculated, as the original process used for estimating the air quality national indicators (prior to 2022) was not calculating the weights in the way intended. An assessment of the impact on the historic data has been undertaken and the impact is small. Given that the air pollution data are modelled and the population estimates are subject to rebasing following the Census, there is existing uncertainty associated with these estimates. Due to this uncertainty, the lack of detailed historic dwelling data and the small impact of the methodological change, the historic data have not been revised.
More information on the data used can be found on the Department for Environment Food & Rural Affairs website.
13. Download the data
13.1 Download the data in this article -Excel
13.2 Download the data from this article with additional breakdowns - CSV